
Storytelling with Data
Overview
This collection of data stories, created for a Storytelling with Data course at the University of Washington, highlights racial and socioeconomic inequalities in coastal access, water quality, and income.
Data Story 1: Who Has Access to Clean Coastal Water in California?
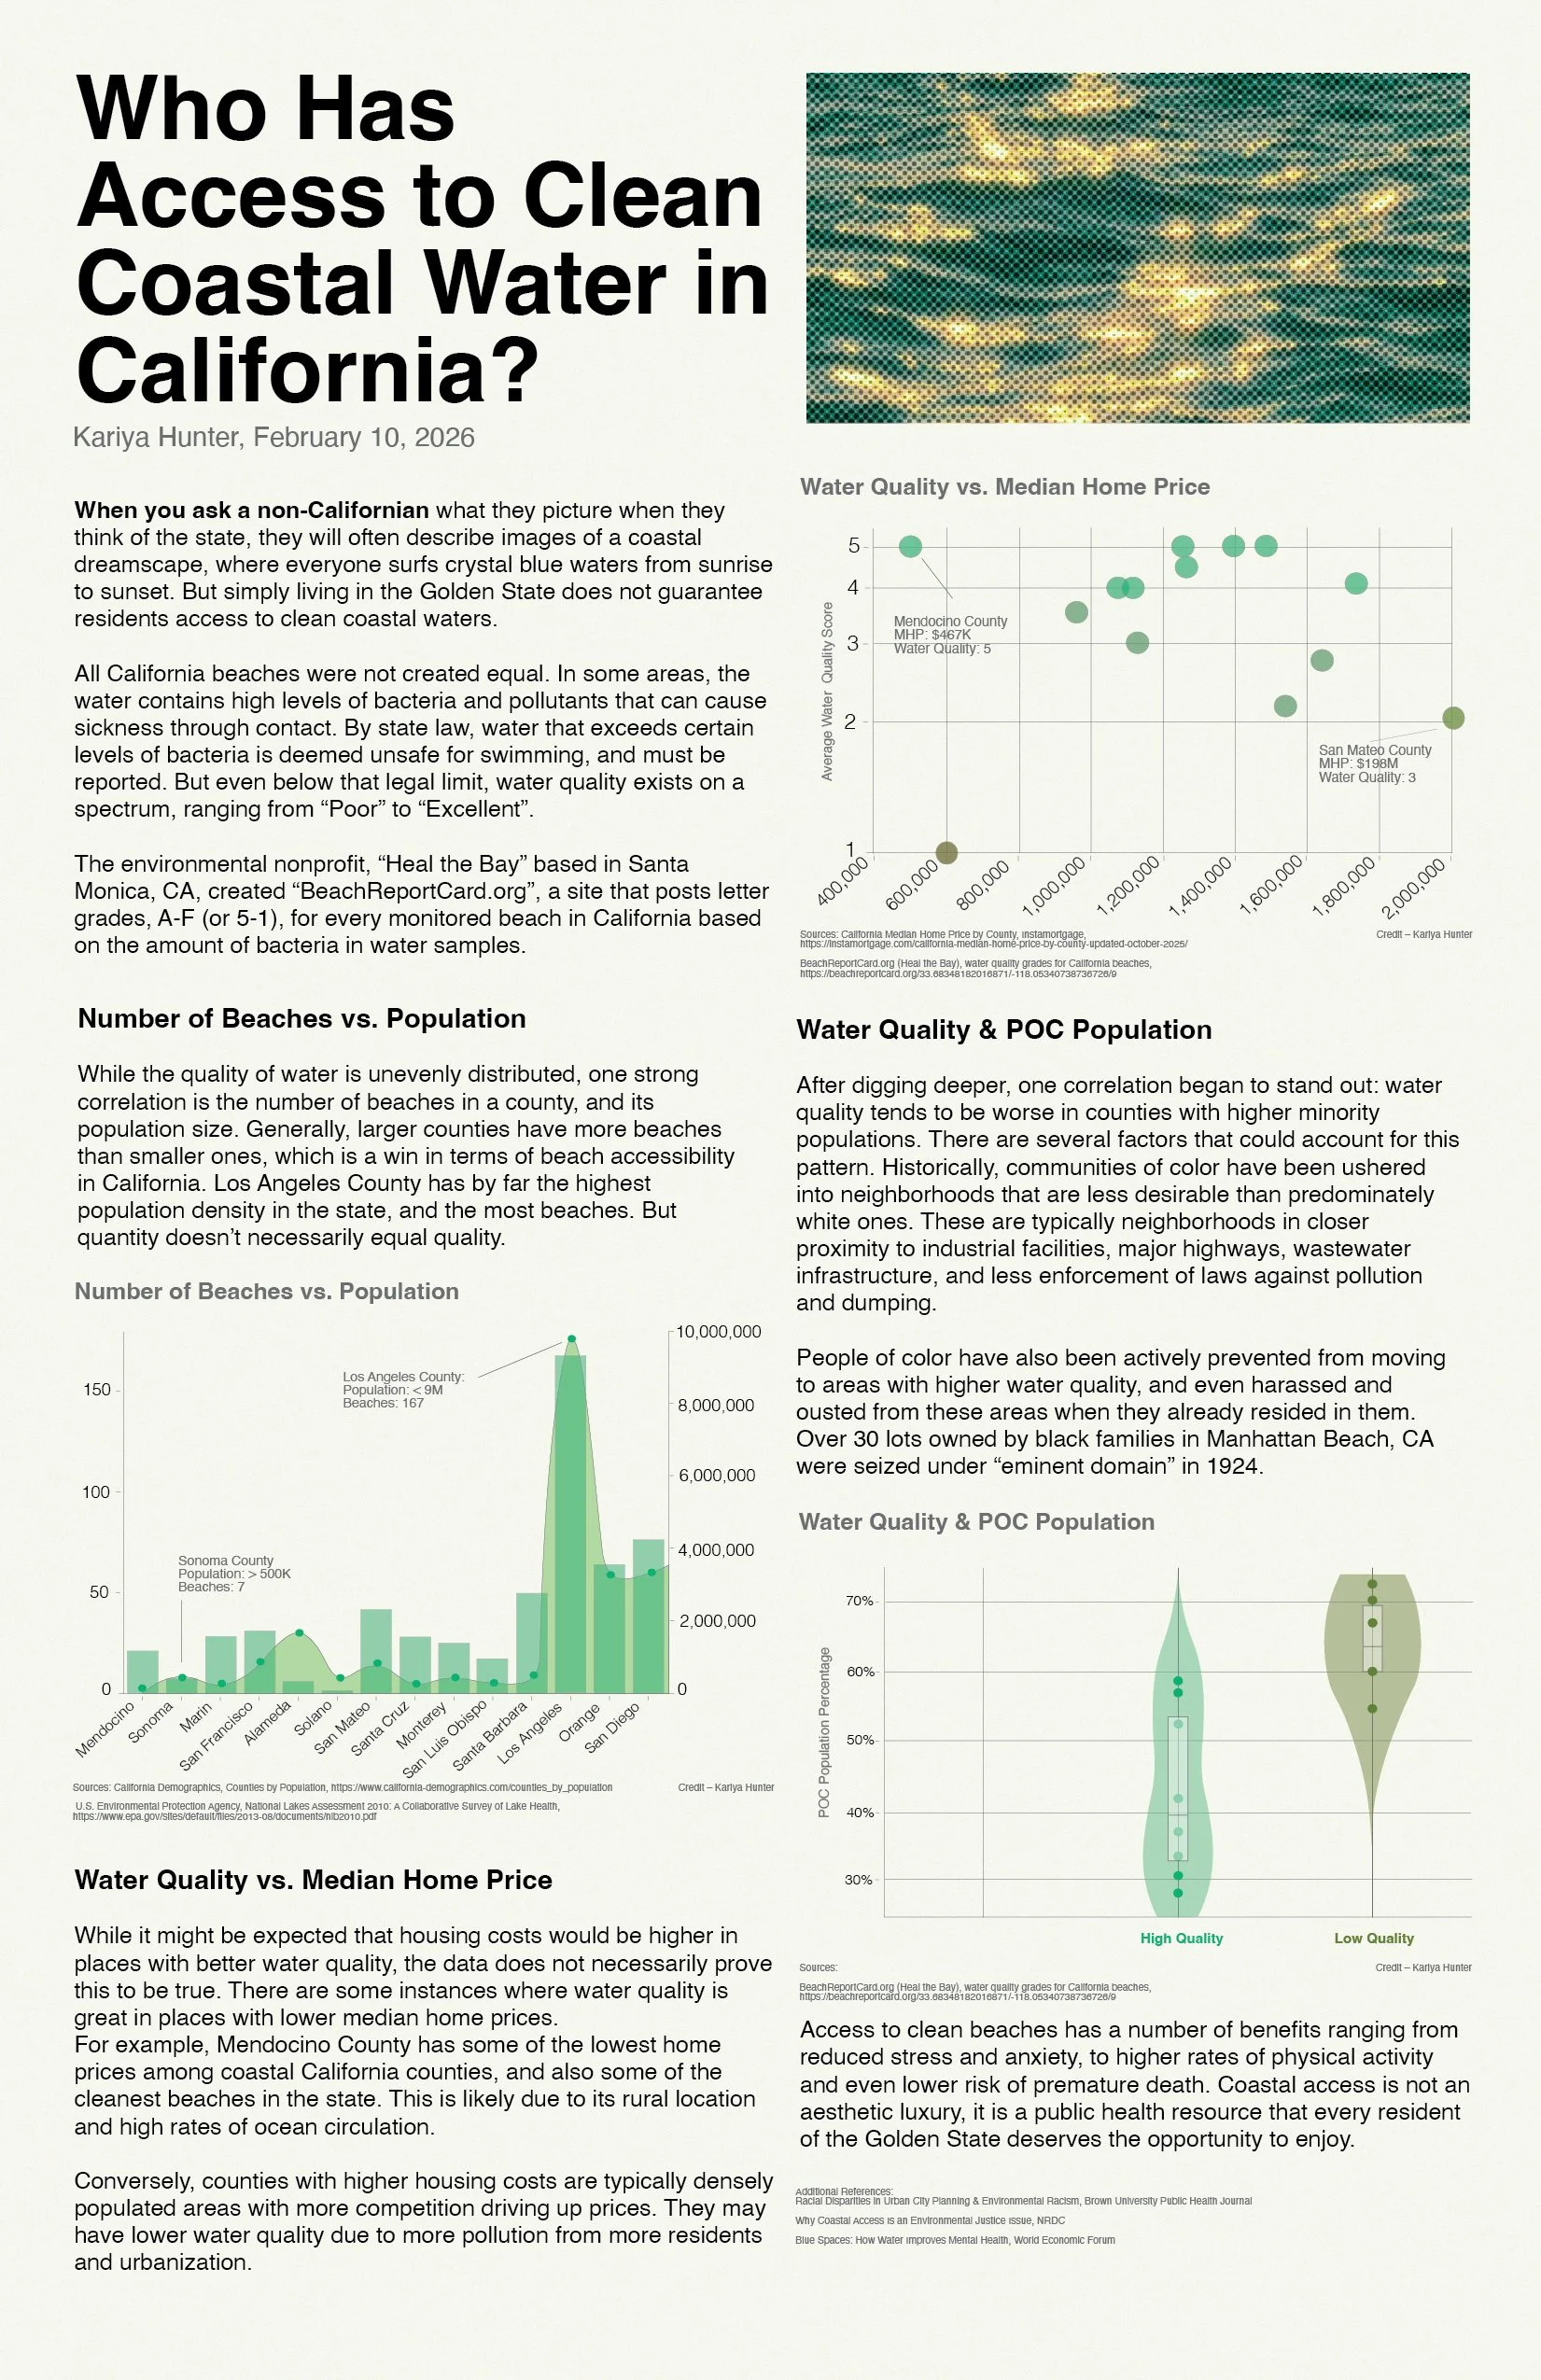
In this data story, I analyze the relationship between water quality, income, and race/ethnicity using California demographic data alongside EPA and Heal the Bay’s Beach Report Card ratings. I created the charts in Datawrapper and Flourish, then cleaned them up and put the entire spread together in Adobe Illustrator.
Assignment 2: The Wealth Divide within Alameda County
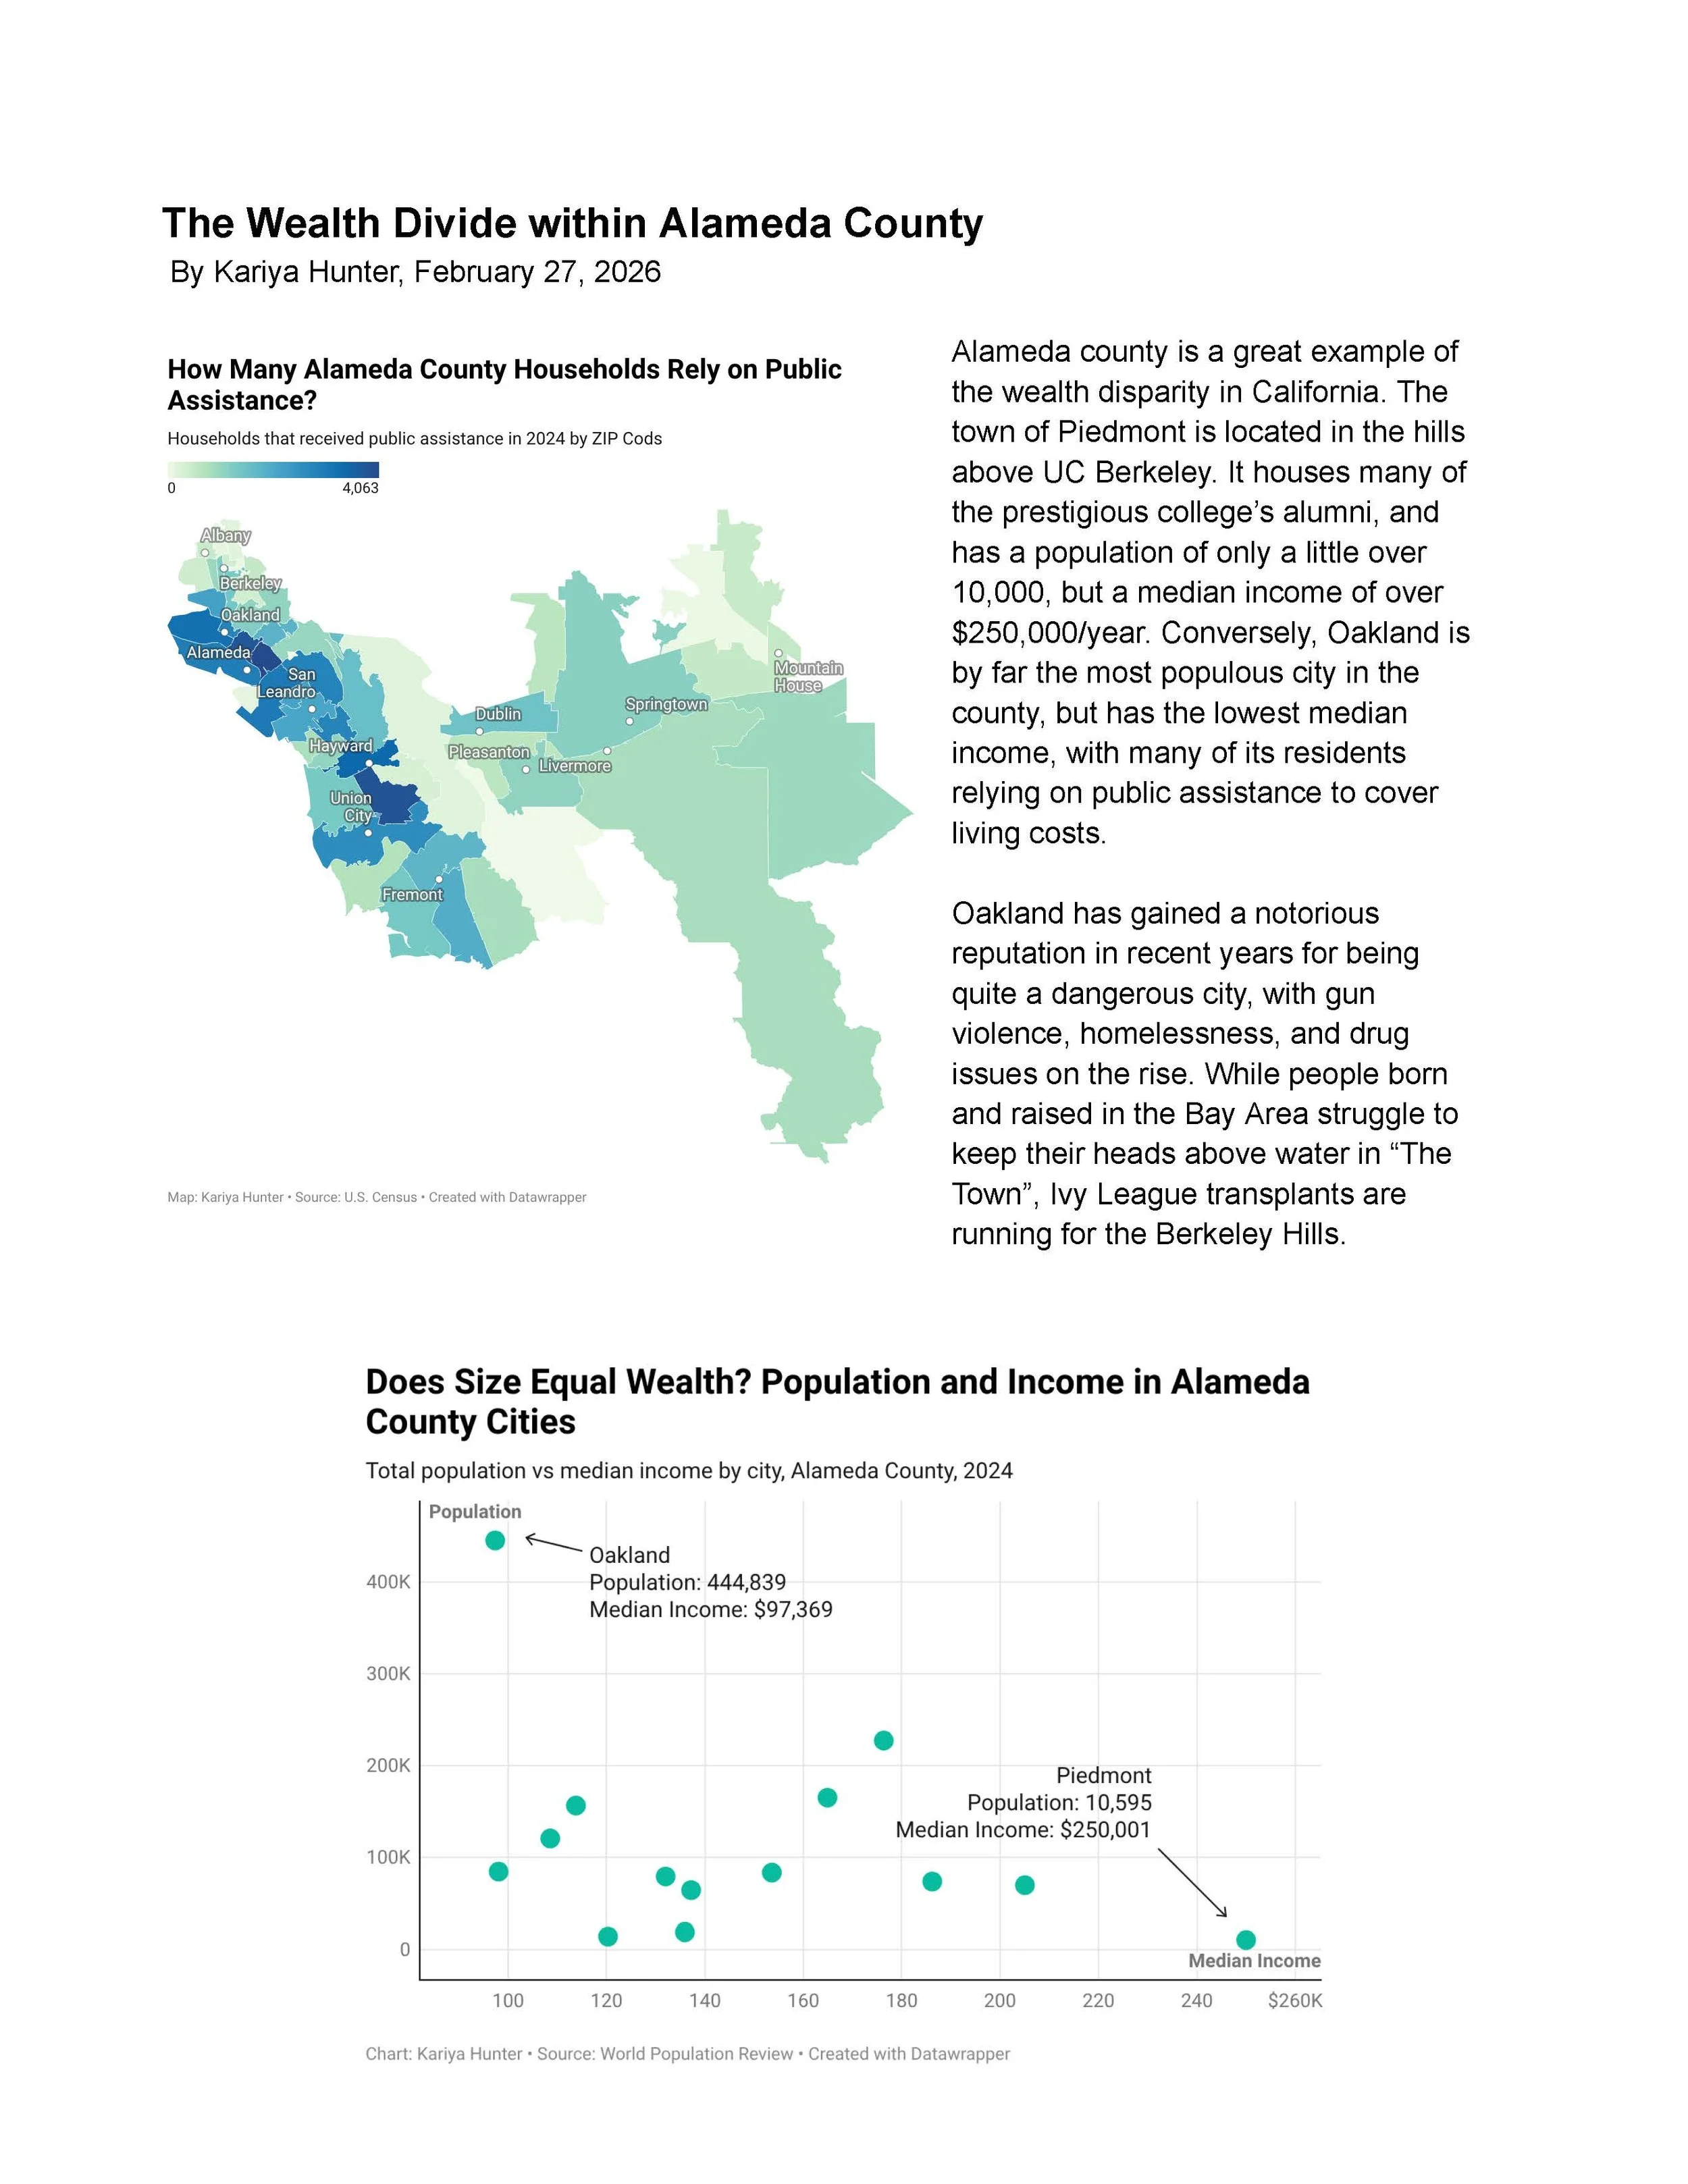
In this project, I used U.S. Census data to visualize the wealth gap in Alameda County through a map and chart created in Datawrapper. The analysis highlights how one of California’s most diverse regions also experiences significant economic disparities between communities.
Final Project: Is There Room for People of Color in Ocean Recreation?
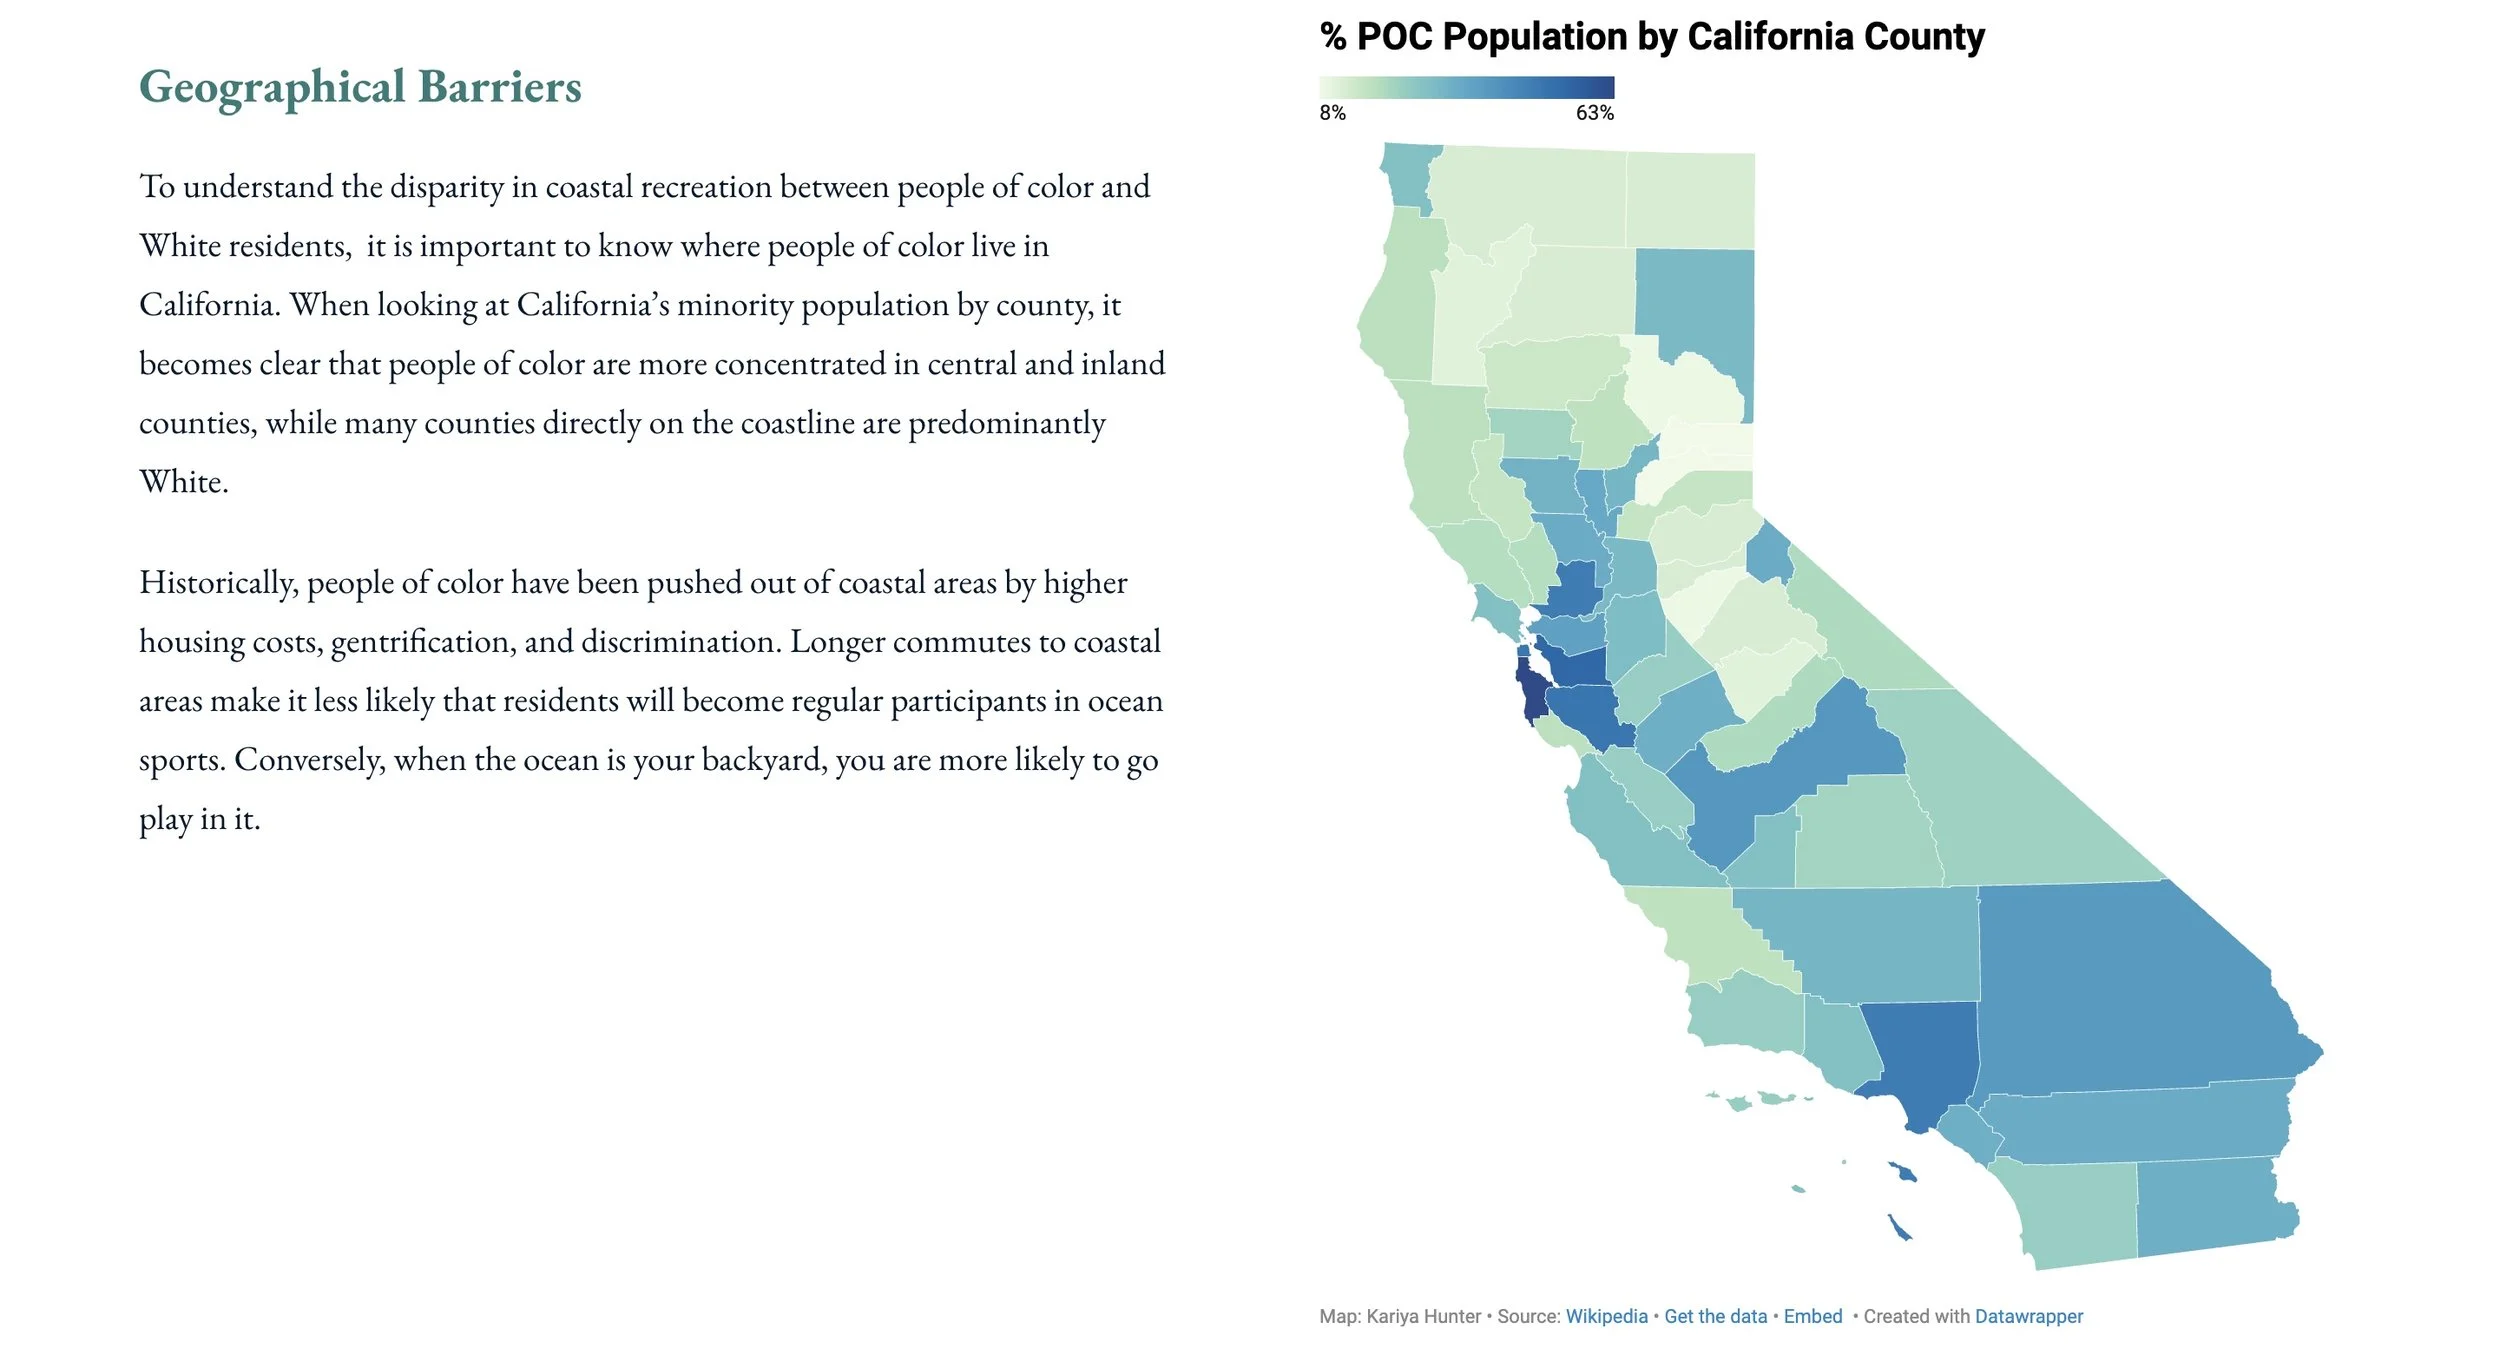
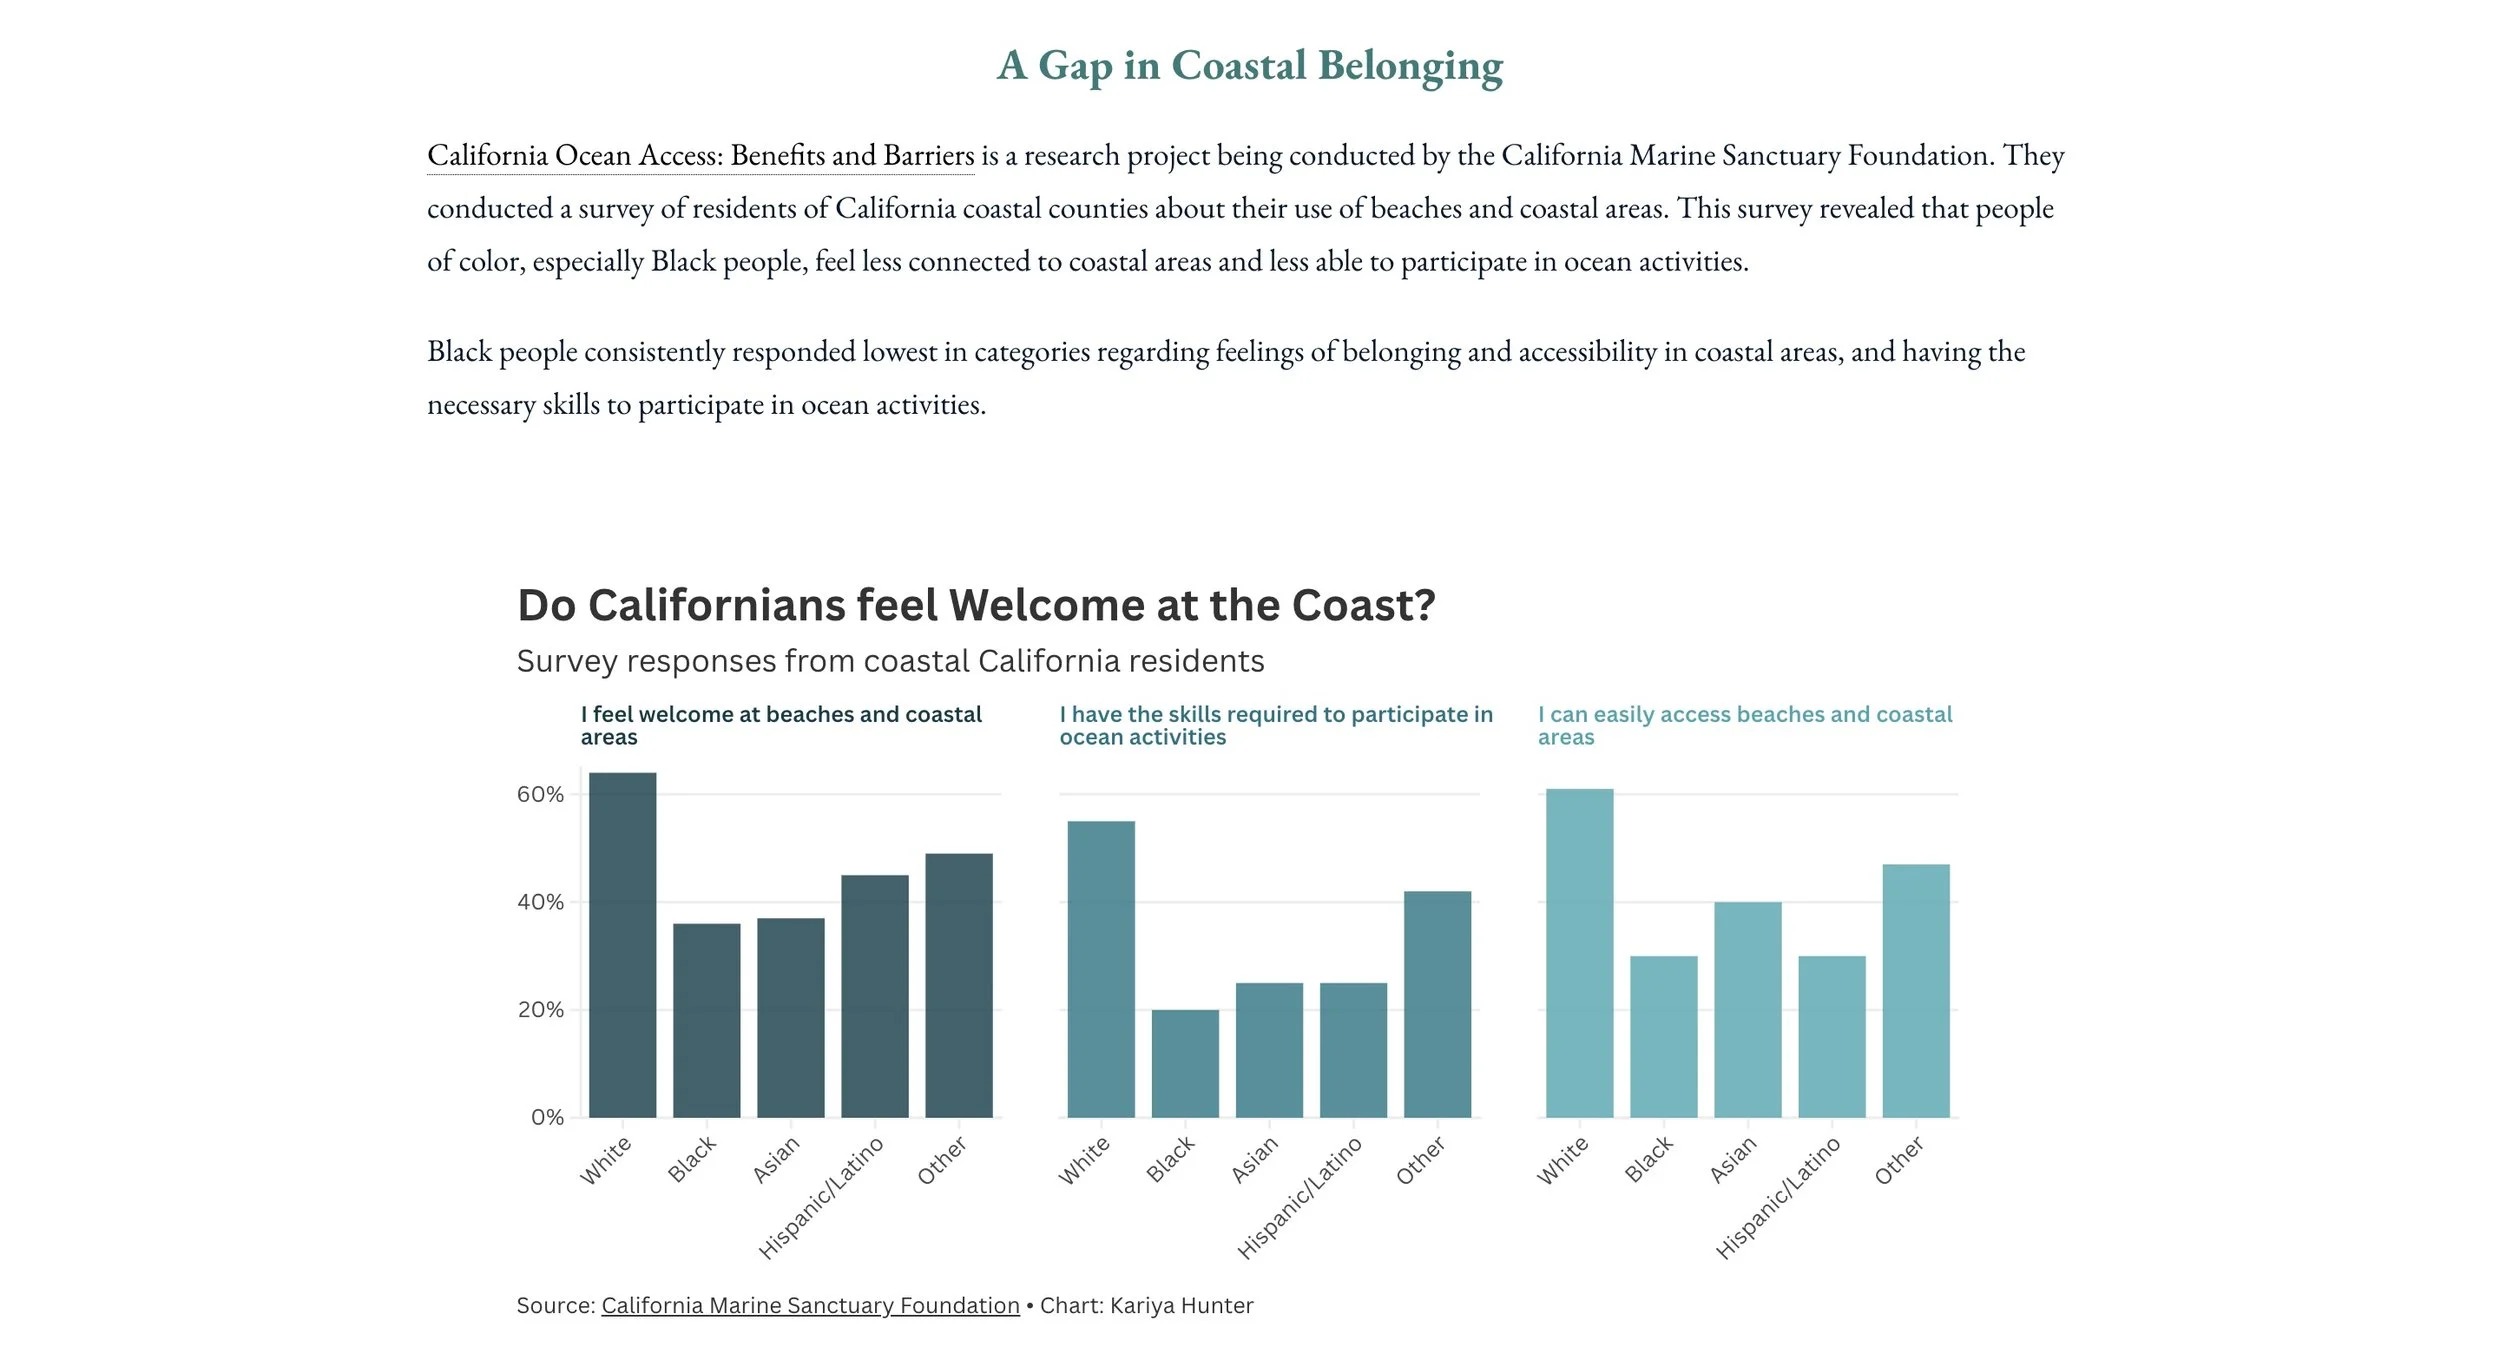
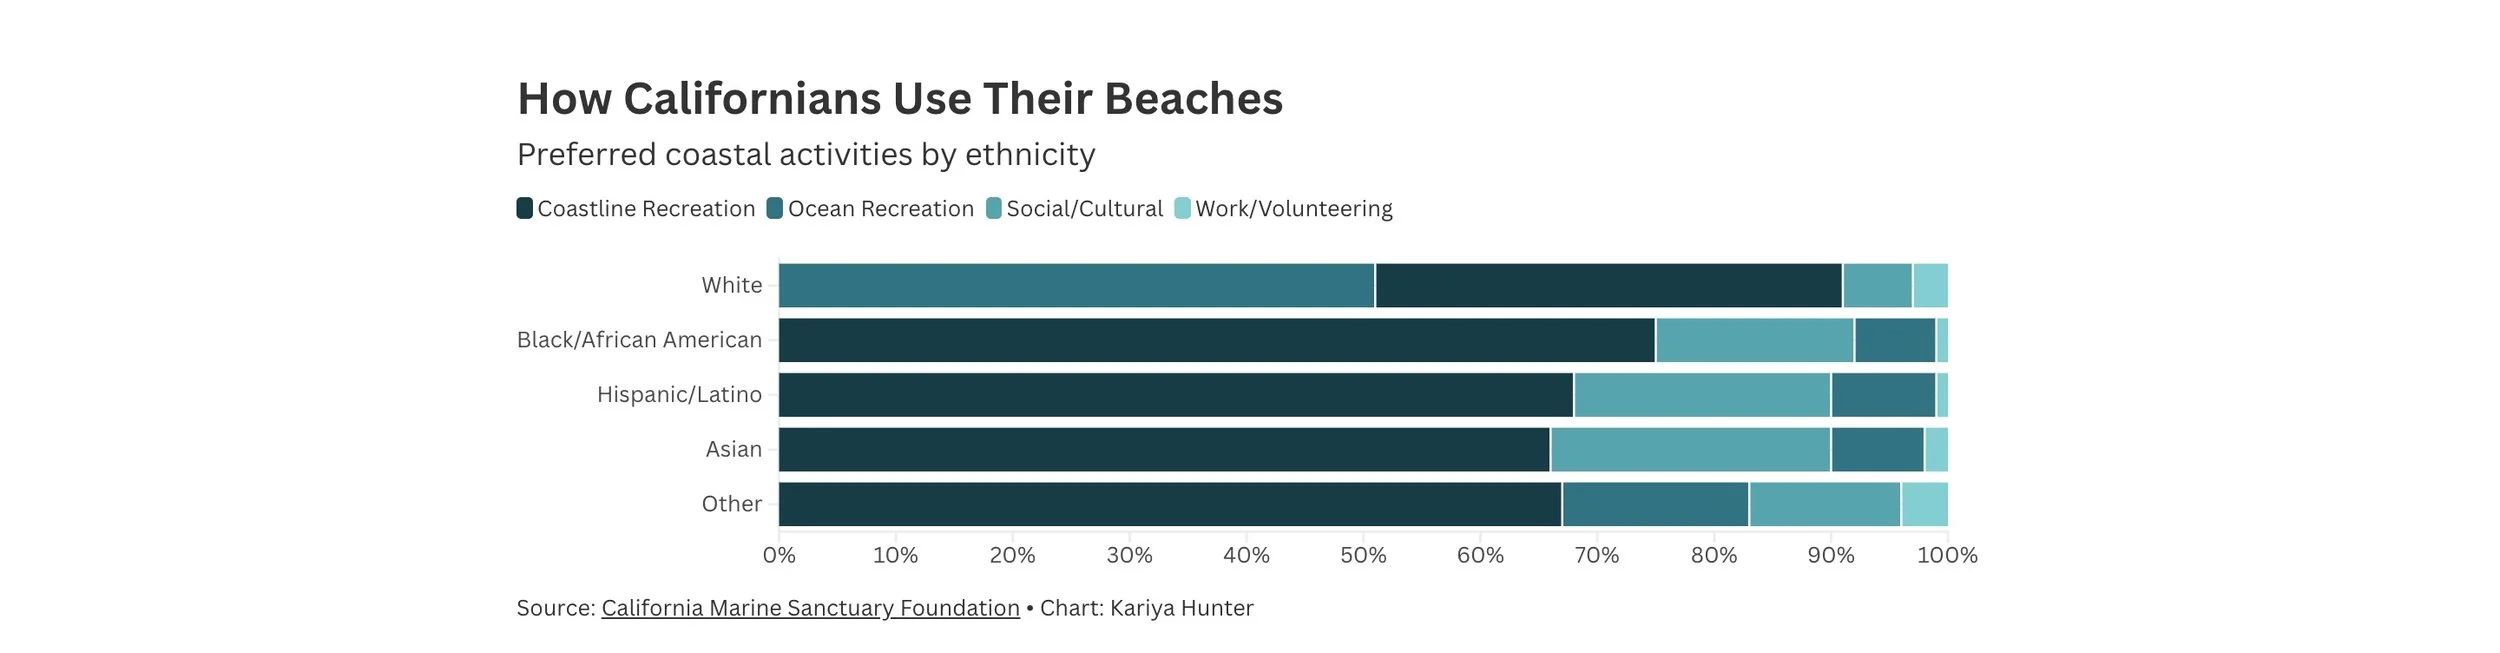
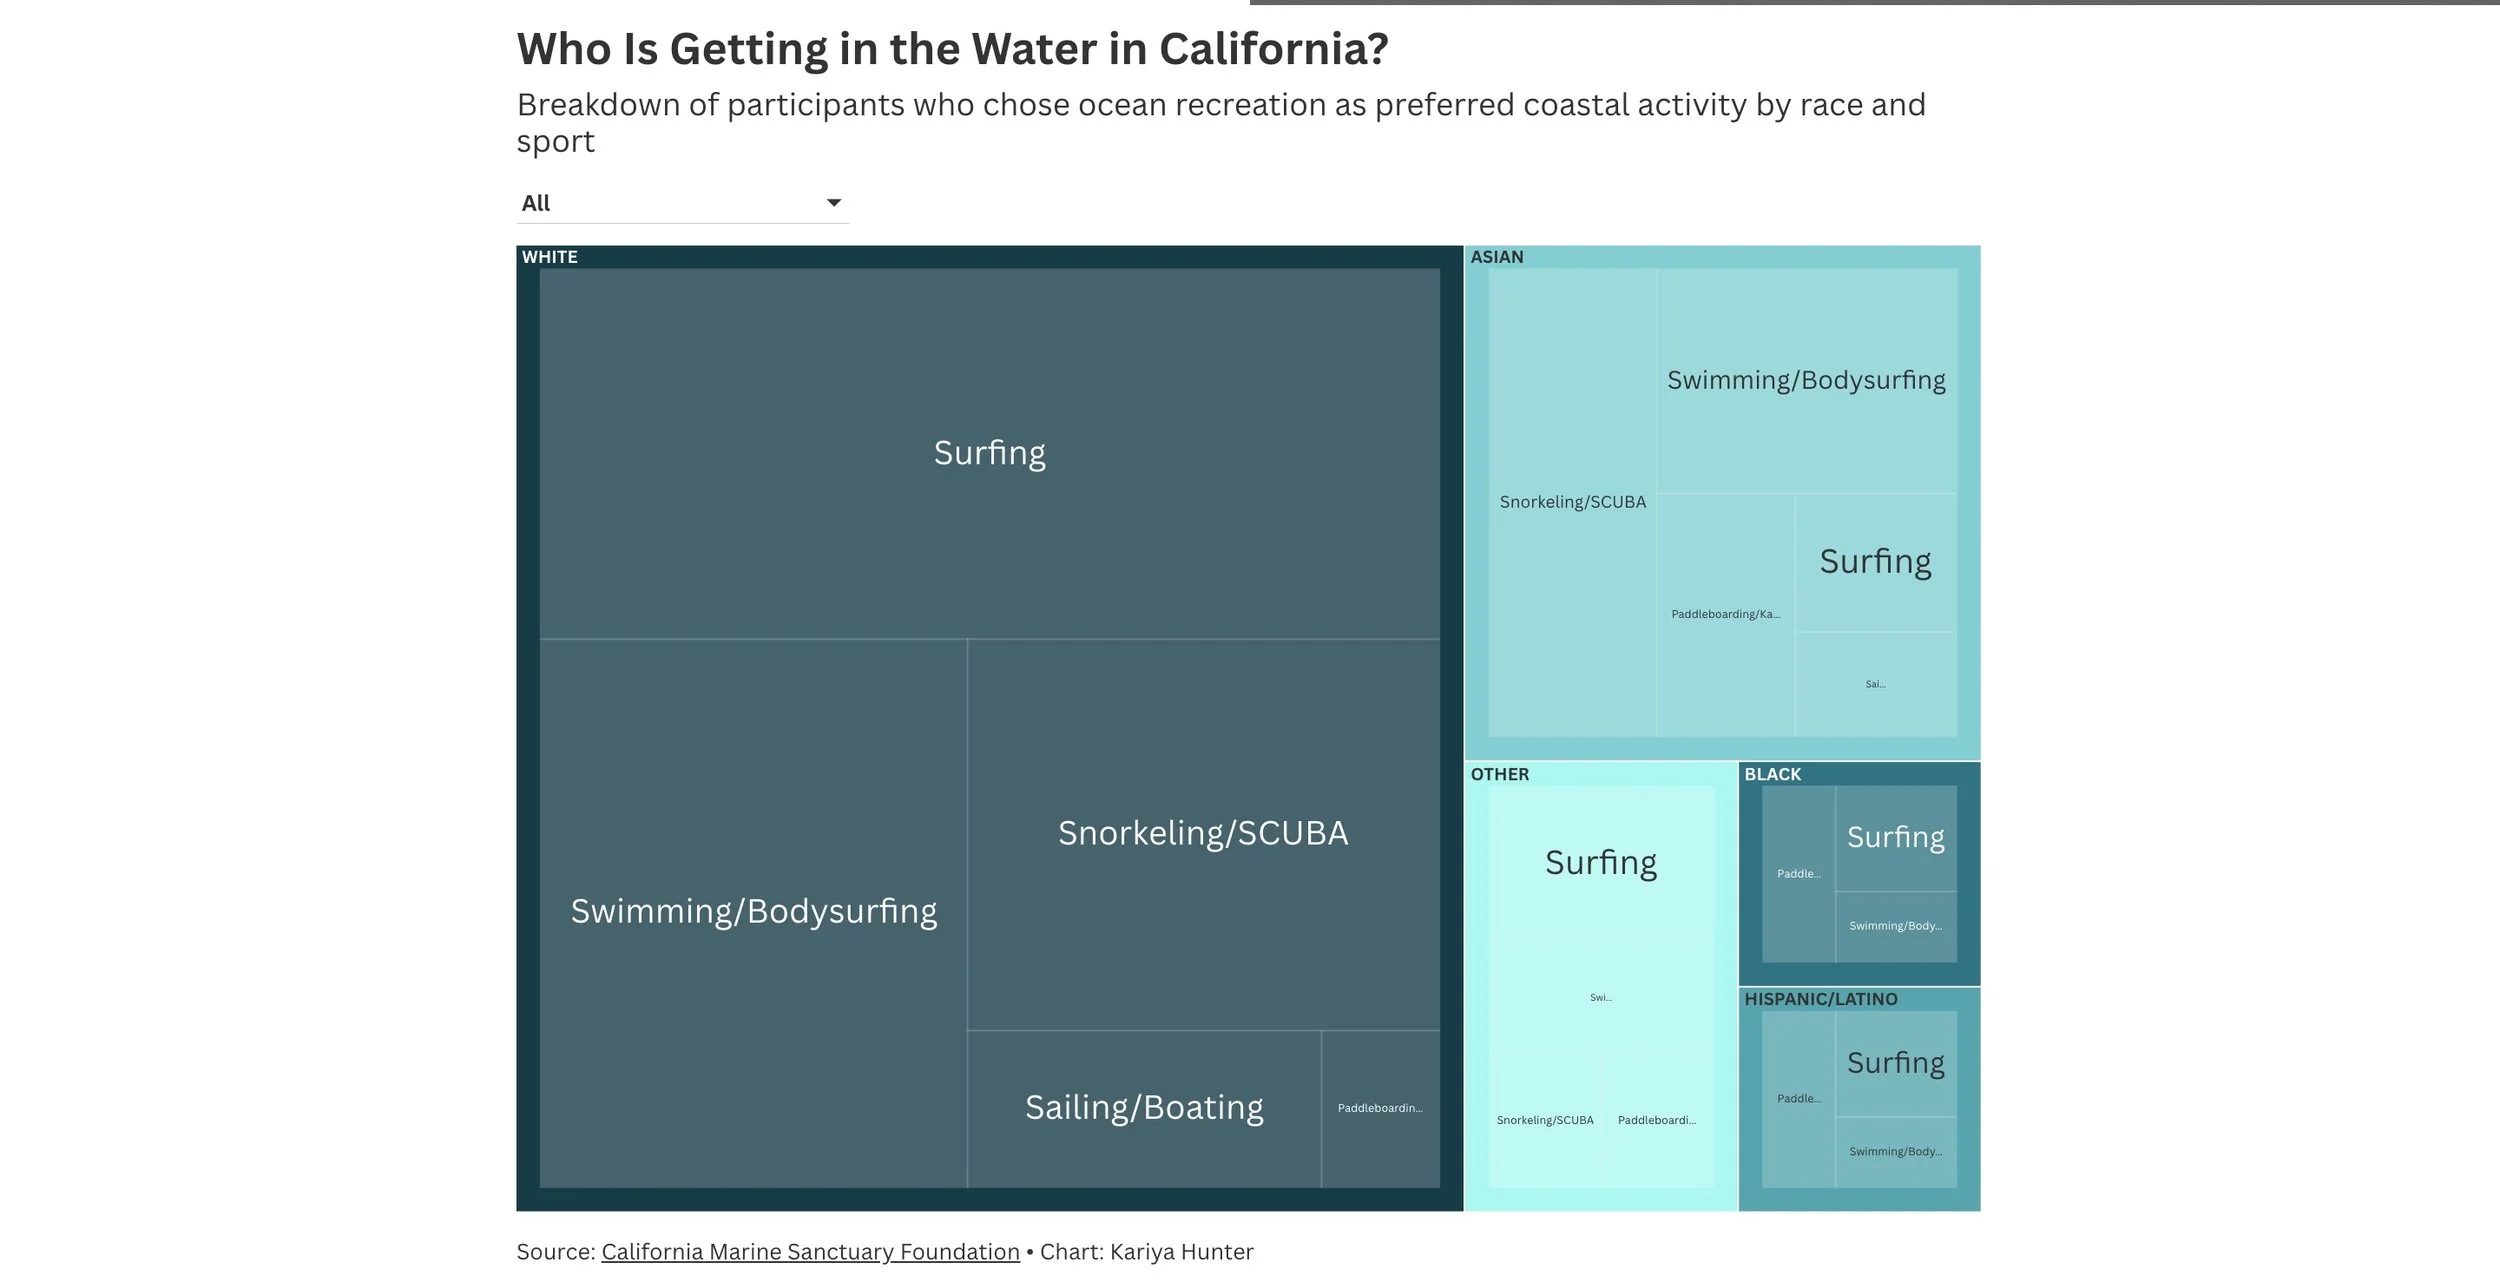
Building on my previous work, this project explores disparities in how different racial and ethnic groups use coastal areas, with a focus on underrepresentation in ocean activities. I used census data and survey data collected by the California Marine Sanctuary Foundation to create visualizations in Datawrapper and Flourish. I then created a website using Shorthand to present the final story.